
During MEF16 in Baltimore we were demonstrating the PNDA Analytics platform to show that PNDA is an excellent choice for the analytics needs of the MEF Lifecycle Services Orchestration architecture.
The first step in building any analytics solution is to collect and aggregate data together. We wanted to show that there is increased value in gathering multiple datasets that would normally be in separate silos, thus enabling analytics across datasets. To this end we set up a system to collect both netflow and syslog data while also enabling people to hack on collecting performance metric data during the MEF16 LSO Hackathon.
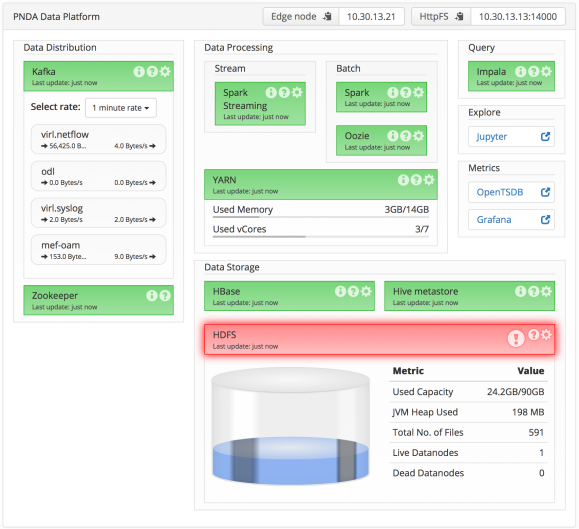
The PNDA platform gives considerable freedom in how to collect data. It uses kafka for ingesting the data so any tool that can publish data on a kafka topic can be integrated with PNDA. Here I will describe the setup we used for each dataset we collected.
Network Environment
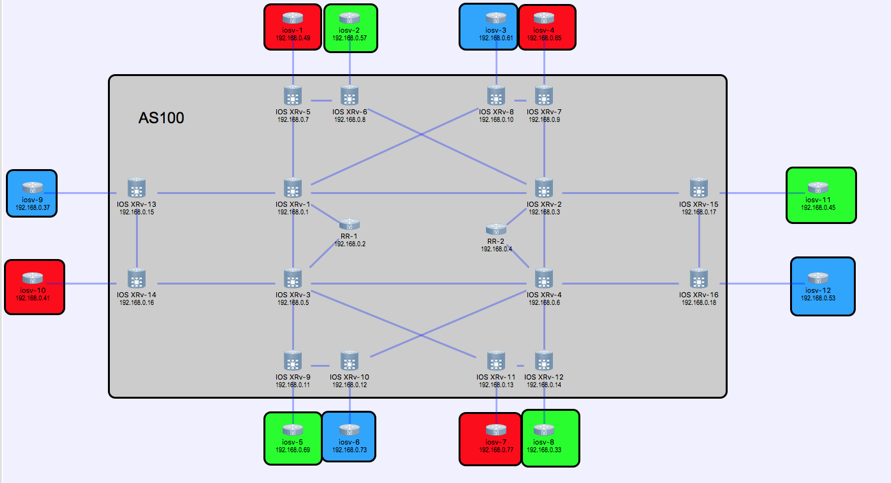
We ran a modestly sized demonstration network using VIRL. This network contains a mixture of IOSv and XRv instances. It serves as a good source of syslog and netflow data. It is also big enough to support some interesting failure scenarios.
Forwarding Netflow Data to PNDA
There are a variety of tools available for collecting Netflow data. A high throughput choice might be pmacct, but for ease of deployment I chose to use logstash. There is an existing netflow codec plugin provided by logstash so the configuration is very straightforward:
input {
 udp {
 port => 2055
 codec => netflow { }
 add_field => [ "src", "netflow" ]
 }
}

filter {
 json_encode {
 source => "netflow"
 target => "message"
 }
 mutate {
 remove_field => [ "netflow" ]
 }
}

output {
 kafka {
 topic_id => "netflow"
 bootstrap_servers => "{kafka-host}:9092"
 value_serializer =>
    "org.apache.kafka.common.serialization.ByteArraySerializer"
 codec => platformavro { }
 }
}
I used a plain udp input plugin to listen on port 2055 for netflow messages. The netflow codec recognises netflow templates in the message flow and uses them to decode messages into a map of fields. I used a json_encode filter to serialize the fields into a message string that is suitable for sending to PNDA.
The output gets sent directly to the kafka message bus in PNDA so it needs to be encoded
with the AVRO schema that PNDA expects. I used the platformavro codec that is provided
by PNDA.
Forwarding Syslog Messages to PNDA
I used the following logstash configuration to collect syslog messages and send them to
PNDA on a new topic:
input {
 udp {
 port => 514
 type => "syslog"
 }
}

filter {
 if [type] == "syslog" {
 grok {
 match => { "message" => [
 # IOS-XR 6.x.x
 "<%{INT:priority}>%{NUMBER:seq#}: %{DATA:node}:%{CISCOTIMESTAMP:log_date} : %{DATA:process}\[%{INT:pid}\]: %%{WORD:category}-%{WORD:group}-%{INT:severity}-%{WORD:mnemonic} : %{GREEDYDATA:message}",
 # IOS
 "<%{INT:priority}>%{NUMBER:seq#}: \*%{CISCOTIMESTAMP:log_date}: %%{WORD:category}-%{INT:severity}-%{WORD:mnemonic}: %{GREEDYDATA:message}" ]
 }
 overwrite => [ "message" ]
 }
 }
}

output {
 kafka {
 topic_id => "syslog"
 bootstrap_servers => "{kafka-host}:9092"
 value_serializer => "org.apache.kafka.common.serialization.ByteArraySerializer"
 codec => platformavro {}
 }
}
The logstash configuration is very straightforward. I used a plain udp input to listen on the default syslog port 514. If you want to avoid launching logstash as root then you can select an unreserved port and configure all devices to send messages on your chosen port.
The trickiest part is mapping each syslog message into separate fields, for which I used the grok filter plugin. The logstash provided `syslog` input plugin is no good because it only supports RFC3164 and we need support for RFC5424. I chose to use separate match patterns for IOS-XR and IOS-classic devices.
Just as we did with netflow, the output gets sent directly to the kafka message bus in PNDA, with the required AVRO encoding.
It is also quite simple to send the parsed syslog messages directly to Elasticsearch with this output configuration:
output {
 elasticsearch {
 hosts => [ "{elastic-host}" ]
 }
}
Forwarding OpenDaylight Events to PNDA
The final piece we wanted to enable was gathering performance metrics using the OpenDaylight SDN Controller. Cisco has contributed an OpenDaylight plugin that forwards events from OpenDaylight onto the kafka message bus, with the AVRO encoding required by PNDA. You can get the plugin from Cisco DevNet.
The odl-kafka-plugin can be built and added to any OpenDaylight installation. It simply
registers for messages on the OpenDaylight message bus and sends them on to kafka. It can be configured to listen for specific topics or, by default, listen for any topic. I used the
simplest configuration which listens for any topic:
PUT http://localhost:8181/restconf/config/kafka-agent:kafka-producer-config
{
 kafka-producer-config: {
 kafka-broker-list: "{kafka-host}:9092",
 kafka-topic: "odl",
 compression-type: "none",
 message-serialization: "avro",
 avro-schema-namespace:"com.example.project"
 }
}
The remaining step is to configure the OpenDaylight Event Aggregator. I created a new topic that will aggregate all notifications for all available nodes:
POST http://localhost:8181/restconf/operations/event-aggregator:create-topic
{
 "event-aggregator:input" : {
 "notification-pattern" : "*",
 "node-id-pattern" : ".*"
 }
}
With this done, we were able to hack on performance metric collection in the
MEF OpenCS Packet WAN hackathon project.
Investigating the Collected Data
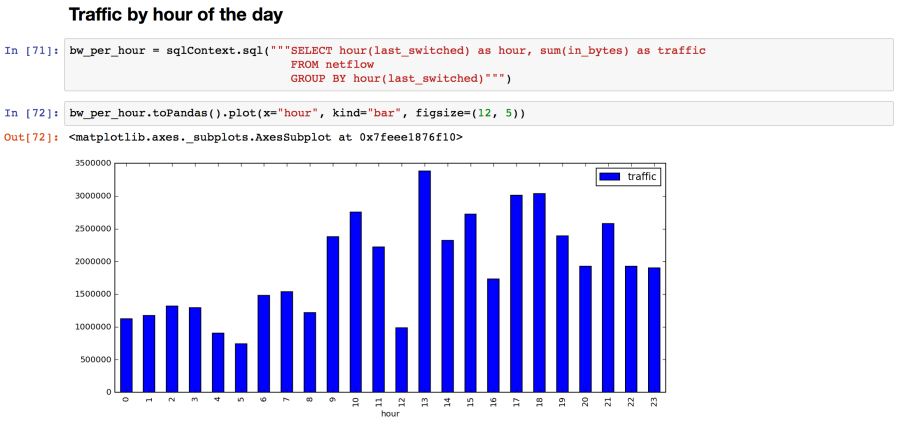
Of course the fun part is getting to run analytics on the collected data. We had a sample Jupyter Notebook ready to process collected netflow data. Using a Jupyter Notebook it is quick and easy to analyse the data and graph the results:
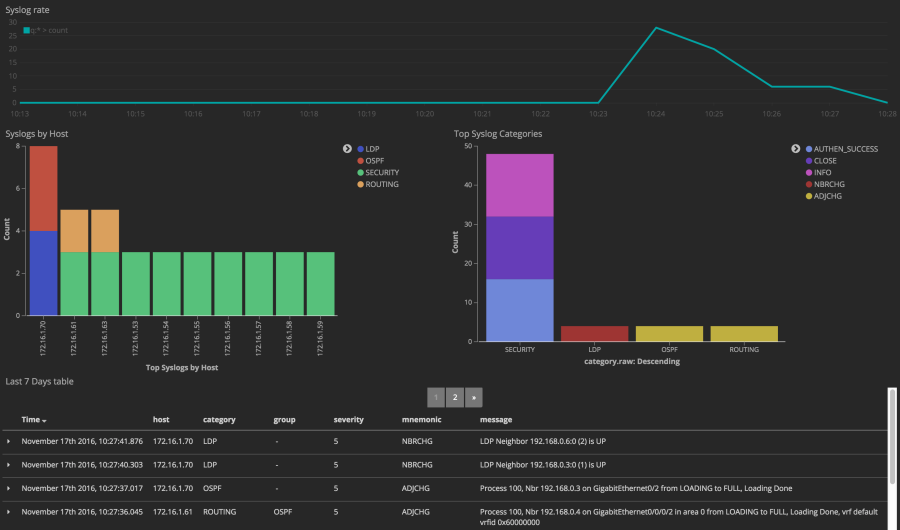
Another great tool for investigating the collected data is the Kibana dashboard on Elasticsearch. Here we show the incoming syslog rate and then chart the collected syslog messages, grouped by device and by syslog category:
Next Steps
The setup here lays a good foundation for enabling data scientists to investigate what insight can be discovered from the combined data sets. We plan to build on this to showcase the operational insight that is being specified in the MEF OpenLSO Analytics project.
